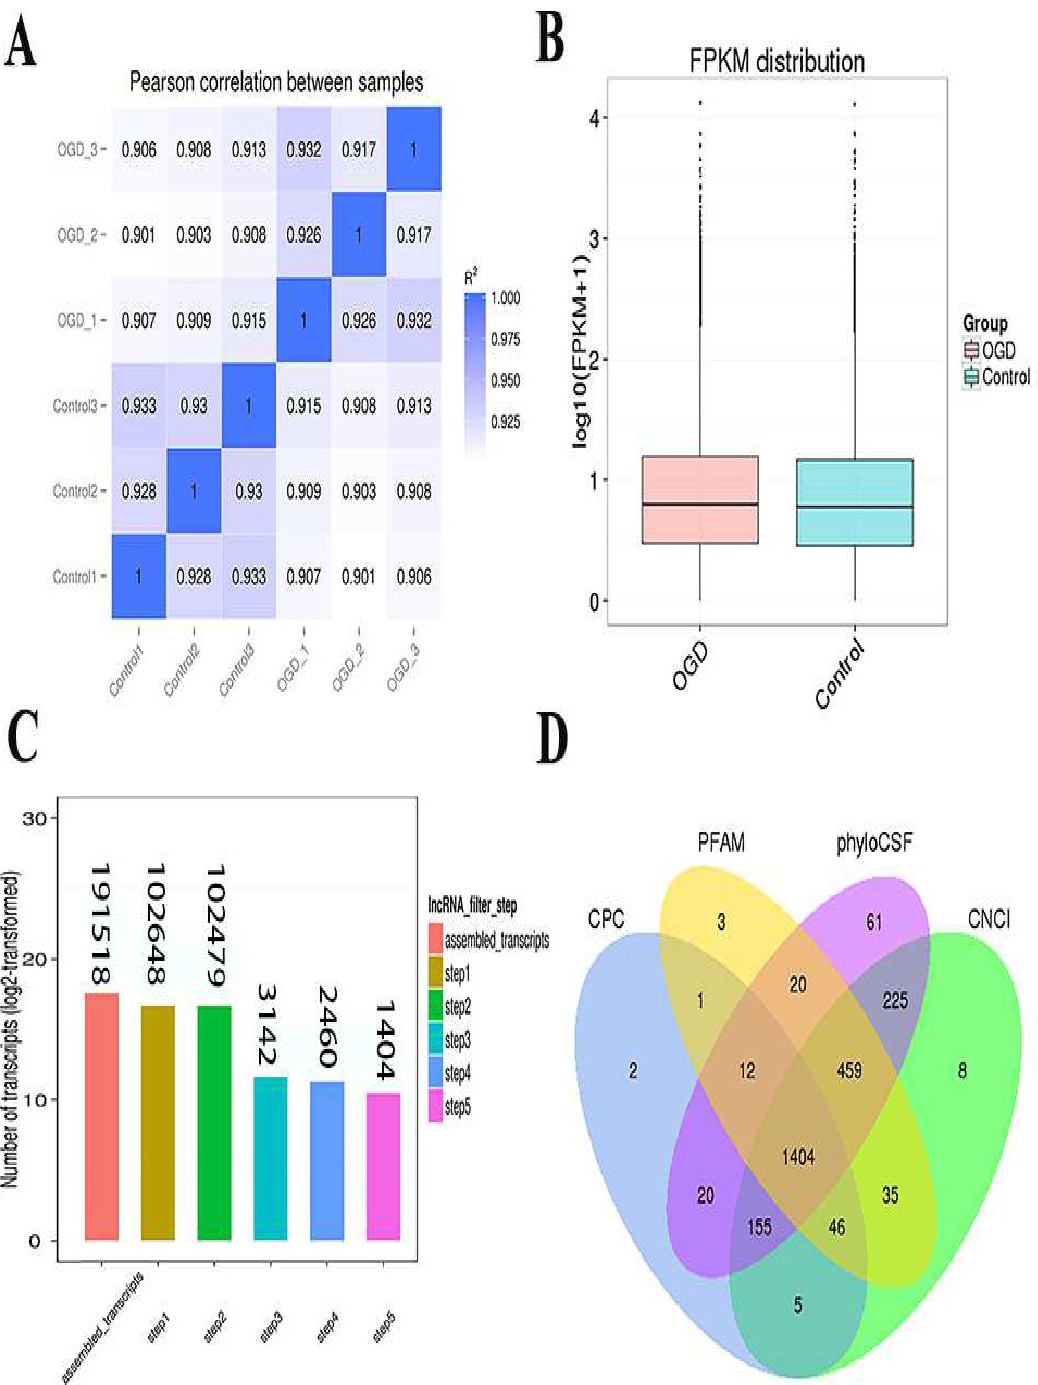
Fig. 3. The evaluation of samples and filtration of lncRNAs. (A) Pearson's correlation coefficient was more than 0.8 for each pair. (B) The box plots of FPKM distribution in each group, indicating no significant differences between the control and OGD/R groups. (C) The transcripts from five steps of filtration are shown. (D) The results regarding the non-coding RNAs exhibited in a Venn diagram. The sum of the numbers in each large circle represents the total number of non-coding transcripts identified by the particular software, and the overlapping part of the circle represents the common non-coding transcripts between the different types of software.